Power BI Widget
Maximize your data insights
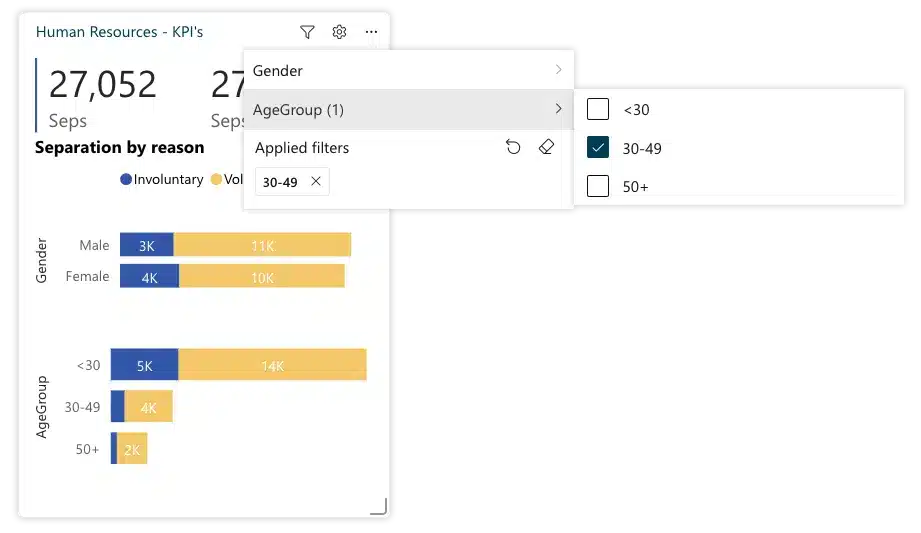
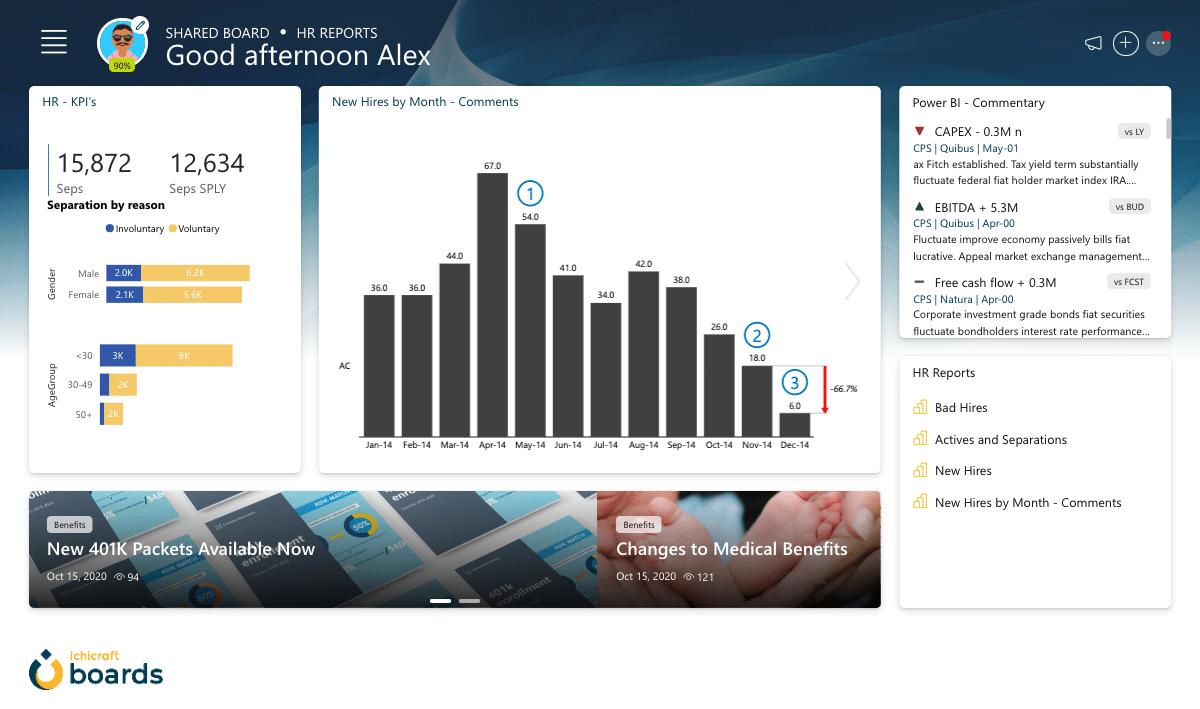
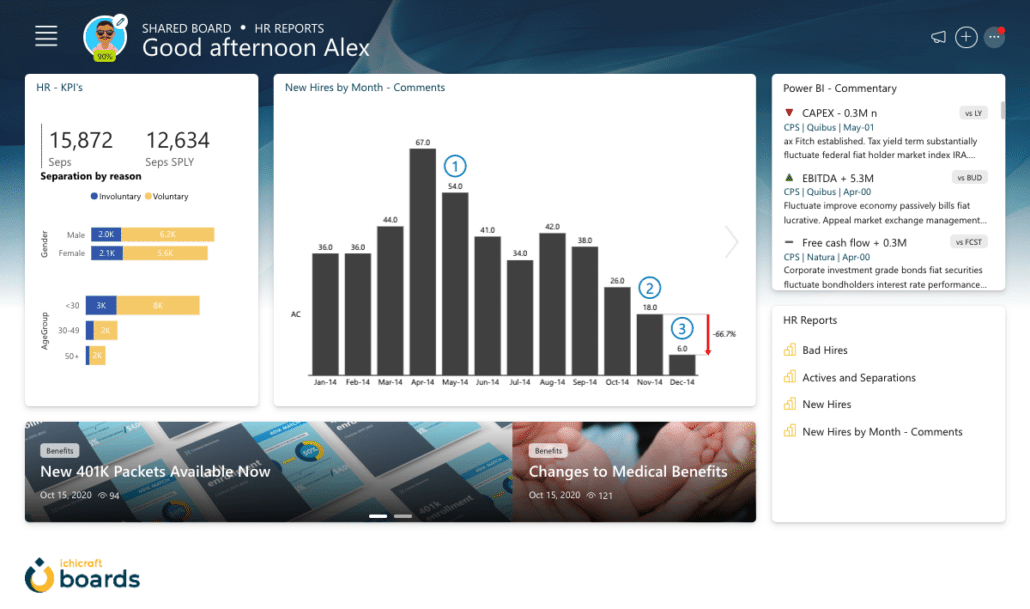
Enhance your Ichicraft Boards dashboard with our cutting-edge Power BI widget. This tool is designed to elevate your data visualization experience, allowing you to display Power BI reports, dashboards, and a variety of visuals directly on your dashboard. Its dynamic filtering capability ensures you can focus on the most relevant data, tailoring the information to your specific needs.
By integrating the Power BI widget with other widgets on your Ichicraft Boards, you create a powerful, customized dashboard. This combination allows for a rich, interactive data analysis experience, presenting various metrics and insights in a visually appealing and intuitive interface.
Highlighted features
Quick access to Power BI reports
Filtering
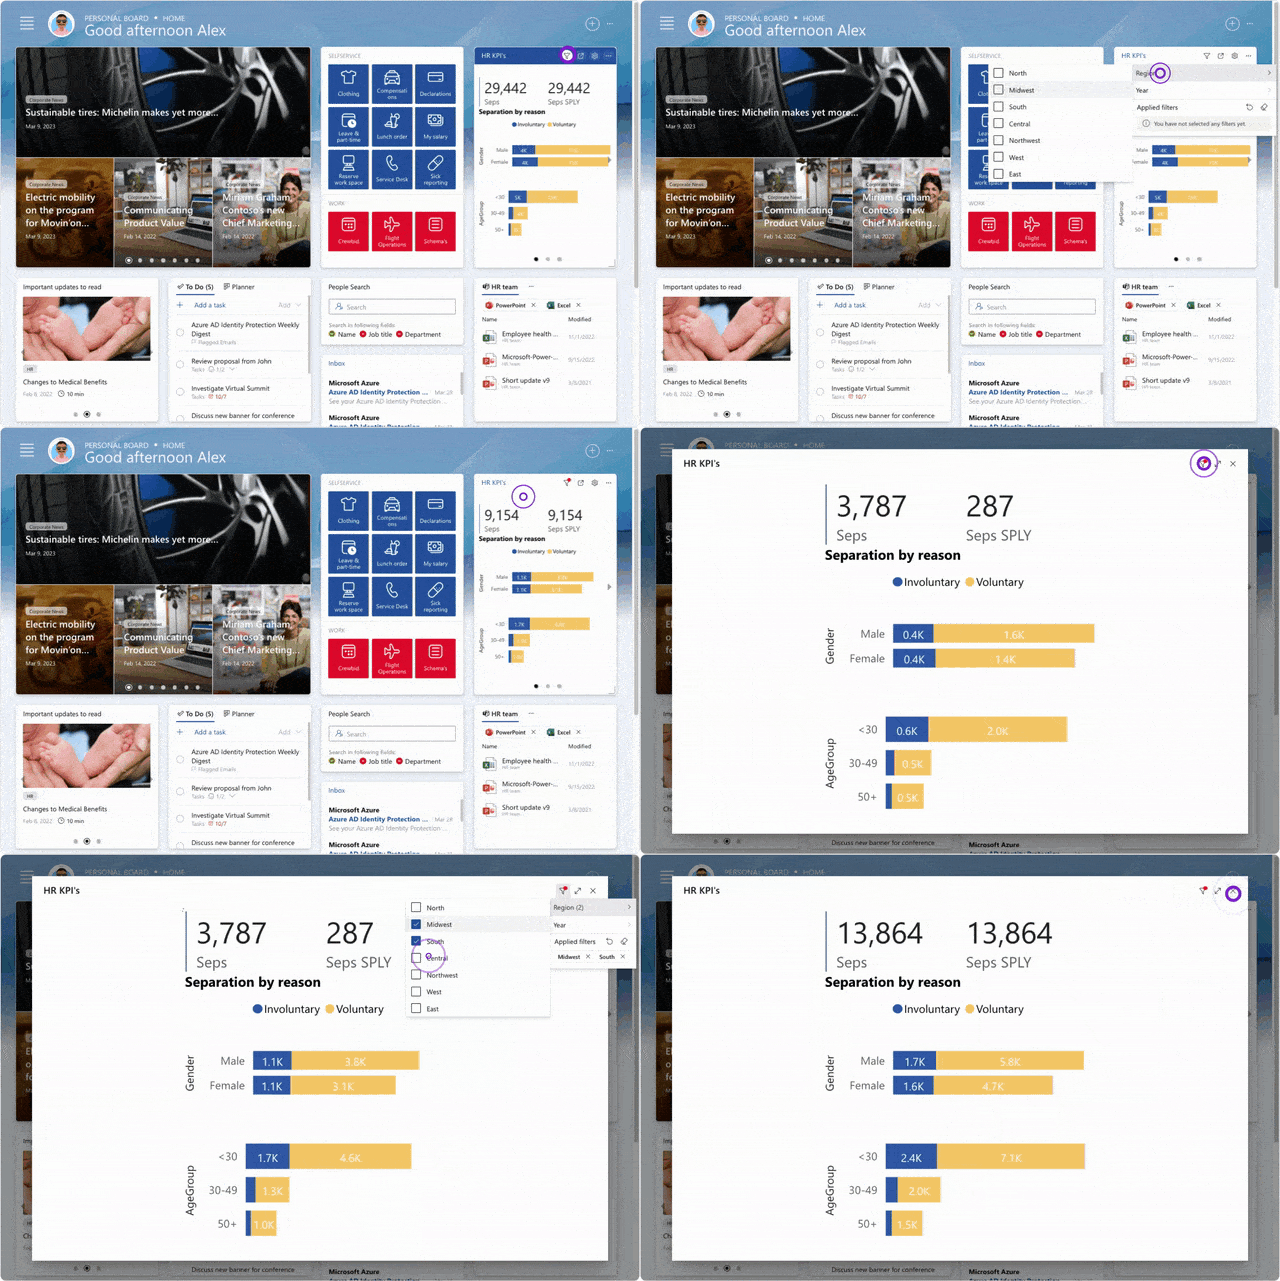
Elevate your data analysis with the widget’s advanced filtering capabilities. Utilize Power BI filters and slicers to swiftly zero in on relevant data, enhancing report focus and efficiency. These intuitive tools allow you to easily navigate and refine large datasets, providing a tailored view of the information that matters most.
Transform your dashboard into a dynamic, responsive tool for insightful data exploration with just a few clicks.
Audience targeting
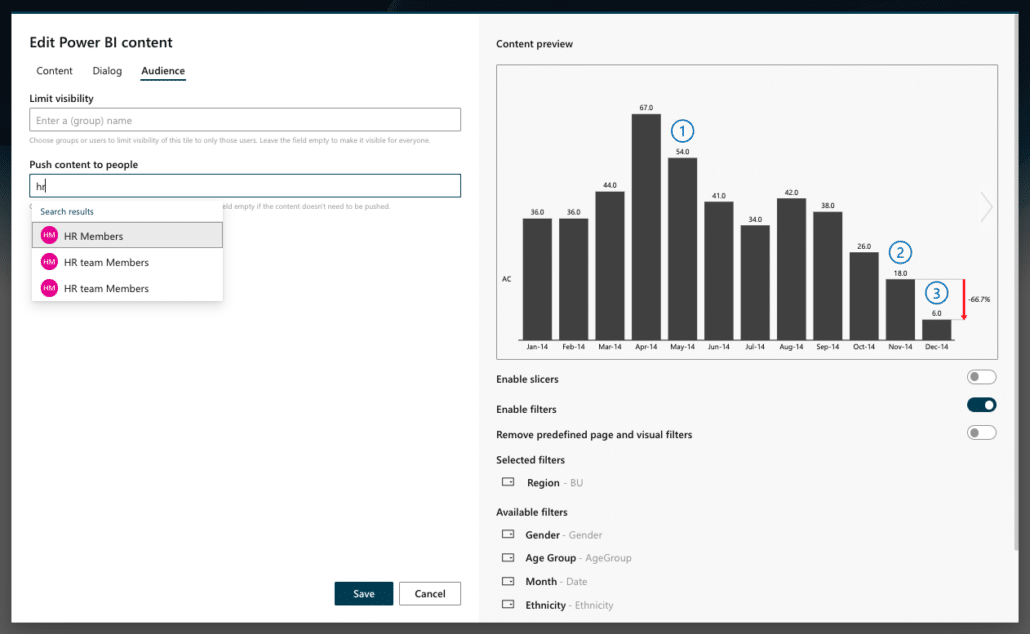
Administrators use the widget’s audience targeting feature to tailor access, displaying only the most relevant reports to each user. It respects and upholds the permissions set within Power BI, guaranteeing data security and appropriate access levels.
By aligning report visibility with user roles and needs, the widget enhances relevance without skipping the integrity of data governance as defined in Power BI.


Configure how it should render
The widget offers flexible configuration options for content rendering to suit your needs. Choose to display a single report, or show multiple reports in a carousel or as a list.
Additionally, optimize the user interaction by configuring the widget to open reports in full-screen mode upon clicking, either the same report or a different one.
